An ecommerce business can have thousands of orders, a growing customer base, and strong monthly sales, yet still struggle to make a decent profit. The reason often lies in the details that sales reports leave out. A product may sell well but carry a thin margin, while a popular sales channel may bring in less profit after fees, ads, and returns. An Ecommerce CFO needs to spot these gaps before they start to affect the business.
The real value of financial tracking is not in collecting more numbers. It is in knowing which numbers deserve attention and what they say about the business. From profit per order and customer acquisition cost to inventory turnover and cash flow, the right metrics help ecommerce owners see where their money goes and what needs to change.
In this blog, we break down the financial metrics that matter most, how to read them, and how they can help an ecommerce business make smarter financial decisions as it grows.
What You Will Learn From This Blog
- Why financial metrics matter for ecommerce growth and control.
- Which sales, profit, cash flow, and stock metrics to track.
- How customer costs and repeat sales affect profit.
- How an Ecommerce CFO uses KPIs to guide key business choices.
- How a virtual CFO for Ecommerce business can help owners read their numbers and plan ahead.
Why Financial Metrics Matter for an Ecommerce CFO
An ecommerce business can have sales from its own site, online marketplaces, social media shops, and other sales channels. Each channel may have its own fees, ad costs, return rates, and payment terms. As a result, total sales alone cannot show how well the business is doing.
An Ecommerce CFO uses key metrics to link sales with the costs and cash needed to earn them. This helps owners see which products make money, which sales channels add value, and where costs are too high.
Financial metrics also help with:
- Better cash flow plans: Track when money comes in and when bills, stock costs, and other dues must be paid.
- Cost control: Spot high ad spend, rising fees, and stock costs that cut into profit.
- Sound growth plans: Check if the business can afford new stock, staff, or sales channels.
- Risk control: Find low margins, slow stock, and weak cash flow before they grow into bigger issues.
- Clear goals: Set sales, cost, and profit targets based on real data.
The right metrics help owners make choices based on facts, not guesswork.
Cash Flow and Working Capital Metrics
A business can show a profit on its income statement and still run short of cash. This can happen when it pays for stock well before it gets paid by buyers or sales platforms. An Ecommerce CFO tracks cash flow and working capital to help the business meet its bills and fund daily needs.
1. Operating Cash Flow
Operating cash flow shows how much cash the business earns or uses through its core work. It takes into account cash from sales and cash paid for stock, staff, shipping, and other day-to-day costs.
A steady rise in sales does not always lead to more cash. For example, a store may sell more goods but have a large amount of cash tied up in stock or unpaid sales.
Track this metric each month to see if the core business can fund its own needs.
2. Cash Conversion Cycle (CCC)
The cash conversion cycle shows how long it takes to turn money spent on stock into cash from sales.
It has three parts:
- Days Inventory Outstanding (DIO): How long stock stays on hand before it sells.
- Days Sales Outstanding (DSO): How long it takes to collect money owed.
- Days Payable Outstanding (DPO): How long the business takes to pay its suppliers.
Formula: CCC = DIO + DSO − DPO
A shorter cycle can help free up cash. An ecommerce CFO can review stock levels, buyer payment terms, and supplier terms to help cut delays.
3. Working Capital
Working capital shows if a business has enough short-term assets to cover its short-term dues.
Formula: Working Capital = Current Assets − Current Liabilities
Current assets may include cash, stock, and money due from buyers. Current liabilities may include supplier bills, tax dues, and short-term debt.
Low or negative working capital may point to a cash strain. It can also limit the store’s ability to buy stock or meet new orders.
4. Cash Runway
Cash runway shows how long a business can keep running with the cash it has if its current cash use stays much the same.
Formula: Cash Runway = Available Cash ÷ Average Monthly Net Cash Burn
This metric is vital for new and fast-growing ecommerce brands. It helps owners plan for slow sales, high stock needs, and new costs. The result is an estimate, so it should be checked against cash flow forecasts.
optional anymore
on running the business
Revenue and Sales Metrics Every Ecommerce CFO Should Track
Sales metrics show how much a business earns and where that income comes from. An Ecommerce CFO should track these figures along with the costs tied to each sale.
1. Gross Revenue and Net Revenue
Gross revenue is the total value of sales before refunds, returns, discounts, and other sales cuts. Net revenue is what remains after these items are taken out.
For example, if an online store makes $100,000 in sales and gives $8,000 in refunds and $2,000 in discounts, its net revenue is $90,000.
This gap helps owners see how much of their sales value the business keeps. A rise in gross sales may look good, but high refunds and discounts can reduce the real income.
2. Average Order Value (AOV)
AOV shows how much a buyer spends per order on average.
Formula: AOV = Total Revenue ÷ Number of Orders
If a store earns $50,000 from 1,000 orders, its AOV is $50.
A low AOV may point to small cart sizes or weak upsell plans. An ecommerce CFO can use this metric to assess offers such as product bundles, free shipping limits, and cross-sell deals.
3. Sales Growth Rate
This metric shows how much sales have grown or fallen over a set time.
Formula: Sales Growth Rate = [(Current Period Sales − Previous Period Sales) ÷ Previous Period Sales] × 100
It helps owners track trends by month, quarter, or year. Still, sales growth should be read with profit and cash flow data. A rise in sales that comes from steep discounts or high ad spend may not add real value.
4. Revenue by Sales Channel
An ecommerce brand may sell through its own site, Amazon, Walmart, or other online markets. Each channel has its own fees and cost needs.
Track revenue by channel to see where sales come from. Then compare that data with channel fees, ad spend, refunds, and profit. This gives a clearer view of which sales paths are worth more to the business.
Profitability Metrics That Show the True Health of an Ecommerce Business
Revenue shows sales, but profit shows what the business keeps. An Ecommerce CFO must track more than one profit metric to see how well the store turns sales into earnings.
1. Gross Profit Margin
Gross profit margin shows the share of net sales left after the cost of goods sold (COGS).
Formula: Gross Profit Margin = [(Net Revenue − COGS) ÷ Net Revenue] × 100
If net revenue is $90,000 and COGS is $45,000, the gross profit margin is 50%.
This metric helps owners review product prices, supplier costs, and discounts. A drop may mean that product costs have gone up or sale prices are too low.
2. Net Profit Margin
Net profit margin shows how much of each sales dollar remains after all costs, such as payroll, rent, software, ads, and tax.
Formula: Net Profit Margin = (Net Profit ÷ Net Revenue) × 100
A store with a high gross margin can still have a low net margin if its ad spend, staff costs, or other overheads are too high.
3. Contribution Margin
Contribution margin shows how much revenue remains after variable costs are paid. These may include product costs, payment fees, shipping, packing, and sales commissions.
It helps owners see if each order adds enough money to cover fixed costs and leave a profit. It is also useful when they set prices, run sales, or review new products.
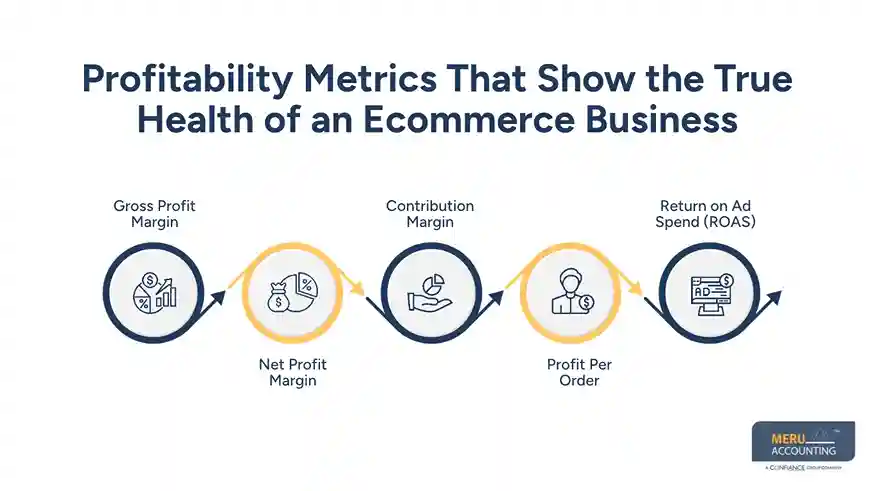
4. Profit Per Order
This metric shows how much profit the business earns from each order after the costs tied to that order are taken out.
An ecommerce CFO can use it to find products or sales channels that bring in many orders but leave little profit. This can help the team review prices, shipping fees, and ad costs.
5. Return on Ad Spend (ROAS)
ROAS shows how much sales revenue a business earns for each dollar spent on ads.
Formula: ROAS = Ad Revenue ÷ Ad Spend
If a brand spends $5,000 on ads and earns $20,000 in sales from them, its ROAS is 4x.
ROAS does not show net profit. The sales may still carry high product, shipping, and platform costs. So, it should be read with contribution margin and profit per order.
Cash Flow and Working Capital Metrics
A business can show a profit on its income statement and still run short of cash. This can happen when it pays for stock well before it gets paid by buyers or sales platforms. An Ecommerce CFO tracks cash flow and working capital to help the business meet its bills and fund daily needs.
1. Operating Cash Flow
Operating cash flow shows how much cash the business earns or uses through its core work. It takes into account cash from sales and cash paid for stock, staff, shipping, and other day-to-day costs.
A steady rise in sales does not always lead to more cash. For example, a store may sell more goods but have a large amount of cash tied up in stock or unpaid sales.
Track this metric each month to see if the core business can fund its own needs.
2. Cash Conversion Cycle (CCC)
The cash conversion cycle shows how long it takes to turn money spent on stock into cash from sales.
It has three parts:
- Days Inventory Outstanding (DIO): How long stock stays on hand before it sells.
- Days Sales Outstanding (DSO): How long it takes to collect money owed.
- Days Payable Outstanding (DPO): How long the business takes to pay its suppliers.
Formula: CCC = DIO + DSO − DPO
A shorter cycle can help free up cash. An ecommerce CFO can review stock levels, buyer payment terms, and supplier terms to help cut delays.
3. Working Capital
Working capital shows if a business has enough short-term assets to cover its short-term dues.
Formula: Working Capital = Current Assets − Current Liabilities
Current assets may include cash, stock, and money due from buyers. Current liabilities may include supplier bills, tax dues, and short-term debt.
Low or negative working capital may point to a cash strain. It can also limit the store’s ability to buy stock or meet new orders.
4. Cash Runway
Cash runway shows how long a business can keep running with the cash it has if its current cash use stays much the same.
Formula: Cash Runway = Available Cash ÷ Average Monthly Net Cash Burn
This metric is vital for new and fast-growing ecommerce brands. It helps owners plan for slow sales, high stock needs, and new costs. The result is an estimate, so it should be checked against cash flow forecasts.
Inventory and Cost Metrics for Better Financial Control
Stock is one of the largest uses of cash for many ecommerce brands. Too much stock can tie up cash, while too little stock can lead to lost sales. An Ecommerce CFO tracks stock and cost data to find the right balance.
1. Inventory Turnover Ratio
This metric shows how often a business sells and replaces its stock over a set time.
Formula: Inventory Turnover = COGS ÷ Average Inventory
A low ratio may point to slow sales, excess stock, or poor demand plans. A very high ratio may mean the store does not hold enough stock to meet demand. The right level depends on the type of goods and sales cycle.
2. Days Inventory Outstanding (DIO)
DIO shows the average number of days stock stays in the business before it sells.
Formula: DIO = (Average Inventory ÷ COGS) × Number of Days in the Period
A high DIO can mean too much cash is tied up in goods that do not sell fast. The team can use this data to plan stock buys and clear slow-moving goods.
3. Inventory Carrying Costs
These are the costs of holding stock over time. They may include storage fees, insurance, damage, loss, and the cost of cash tied up in goods.
Track these costs to see if excess stock is eating into profit. This is vital for brands that use third-party storage or sell on online markets with long-term storage fees.
4. Cost of Goods Sold (COGS)
COGS is the direct cost of the goods a business sells. It may include the cost to buy or make a product and other direct costs needed to get it ready for sale.
Track COGS by product and sales channel. This helps owners spot rising supplier costs, weak prices, and items with low profit margins.
5. Inventory Shrinkage and Write-Offs
Inventory shrinkage refers to stock that is lost due to theft, damage, or errors in stock records. Write-offs occur when goods can no longer be sold at their full value.
Track these costs to find gaps in stock control and reduce losses. Regular stock checks can help keep book records in line with the goods on hand.
Customer Acquisition and Retention Metrics
Getting new buyers can cost a lot. Keeping past buyers may cost less and lead to more sales over time. An Ecommerce CFO tracks these metrics to see if the cost of gaining buyers is in line with the value they bring.
1. Customer Acquisition Cost (CAC)
CAC shows how much a business spends to gain one new buyer.
Formula: CAC = Total Sales and Marketing Costs ÷ Number of New Customers
If a store spends $10,000 to gain 200 new buyers, its CAC is $50.
Track CAC by sales channel and campaign. A sharp rise may mean that ad costs are high or that fewer visitors are turning into buyers.
2. Customer Lifetime Value (CLV)
CLV is the total value a business expects to earn from a buyer over the full time they shop with the brand. It helps owners judge if the cost to gain a new buyer is worth it.
Use past order data, repeat sales, and profit rates to make a fair estimate. Do not treat total sales from a buyer as profit, as product and service costs still apply.
3. Customer Retention and Repeat Purchase Rate
The retention rate shows how many buyers keep coming back over a set time. The repeat purchase rate shows the share of buyers who place more than one order.
These metrics help the team review buyer loyalty, product quality, and post-sale service. A rise in repeat orders can help lower the need to spend as much on new buyer leads.
4. Customer Refund and Return Rate
This metric shows the share of orders or sales value that is paid back due to returns and refunds.
High return rates can cut revenue and add costs for shipping, checks, and stock handling. Track the rate by product and sales channel to find the main causes.
How an Ecommerce CFO Uses Financial Metrics to Improve Business Performance
Tracking metrics is only useful when the business acts on what the numbers show. An Ecommerce CFO reviews these figures to help owners make sound choices and reach their goals.
Here are some ways they use financial data:
- Find weak sales channels: Compare sales, fees, ad spend, and profit by channel to see which ones add the most value.
- Set better prices: Review product costs, shipping, and profit margins before changing prices or giving discounts.
- Plan stock buys: Use past sales and stock turnover to avoid excess goods and missed sales.
- Set budgets: Use past costs and sales trends to set fair targets for ads, staff, and other needs.
- Plan for growth: Review cash flow, working capital, and cash needs before adding new products or sales channels.
- Spot risks early: Watch for falling margins, rising returns, and slow stock before they hurt the business.
The aim is not to track every number at all times. It is to focus on the metrics that link to the business goals and review them at the right time.
Meru Accounting’s Virtual CFO for Ecommerce Business
Knowing your gross margin is one thing; finding out why it dropped is another. The same applies to rising customer acquisition costs, slow inventory turnover, and cash tied up in stock. These figures need to be reviewed together to understand their impact on the bottom line.
At Meru Accounting, we help ecommerce businesses make better use of their financial data through virtual CFO support. Our work goes beyond preparing reports. We help owners assess business performance, understand cost trends, and plan their next steps based on clear financial insight.
Our ecommerce-focused CFO services include:
- Ecommerce KPI and Profitability Analysis: Review gross margins, contribution margins, profit per order, and sales channel performance to identify where the business earns or loses money.
- Cash Flow and Working Capital Management: Track cash needs, supplier payments, stock purchases, and sales receipts to help maintain enough cash for daily operations.
- Inventory Cost and Margin Analysis: Assess COGS, inventory turnover, carrying costs, and slow-moving stock to help control the cost of holding goods.
- Customer and Marketing Cost Analysis: Review customer acquisition costs, repeat sales, and return on ad spend to assess whether marketing spend is generating profitable growth.
- Financial Forecasting and Budgeting: Build sales forecasts, expense budgets, and cash flow plans to support stock purchases, new sales channels, and business expansion.
- Management Reporting: Prepare clear financial reports that bring revenue, expenses, cash flow, and profit trends together for better business decisions.
Whether you need help understanding declining margins, planning cash needs, or assessing the financial impact of expansion, our virtual CFO for Ecommerce business services can help you make decisions with a clearer view of your numbers.
Our Expert Insight
One common issue in ecommerce accounting is treating marketplace payouts as total sales. Platforms like Amazon deduct selling fees, refunds, advertising costs, and other charges before sending payments to sellers. If a business records only the net deposit as revenue, it may understate sales and miss important costs.
For example, a $50,000 marketplace payout does not mean the store made $50,000 in sales. The actual sales could be higher once platform fees, refunds, and other deductions are accounted for separately.
We recommend reconciling marketplace settlement reports with sales records and bank deposits each month. This helps ensure revenue and expenses are recorded correctly and gives an Ecommerce CFO a more accurate view of channel performance and profit margins.
Key Takeaways
- Sales growth alone does not show the true health of an ecommerce business.
- An Ecommerce CFO should track revenue, profit margins, cash flow, and stock costs.
- Contribution margin and profit per order help show which products and channels earn money.
- CAC, CLV, and repeat purchase rates help assess the value of buyer growth.
- Regular KPI reviews help owners spot risks and act before costs rise.
- A virtual CFO for Ecommerce business can help turn financial data into clear plans for growth.
FAQs
Look at gross profit, net profit, and contribution margin rather than sales alone. Factor in product costs, shipping, platform fees, ad spend, refunds, and overhead to see how much money the business actually keeps.
A good CAC depends on product margins, average order value, and repeat purchases. Ideally, the profit from a customer over time should be higher than the cost of acquiring that customer.
Track net revenue, profit margin, platform fees, return rate, average order value, and customer acquisition cost for each channel. This helps identify which channels bring in the most profitable sales.
Reduce excess inventory, review supplier payment terms, control operating costs, and plan stock purchases around sales demand. These steps can help free up cash without relying only on higher sales.
A virtual CFO helps with financial reporting, cash flow forecasts, budgeting, KPI analysis, and profit planning. They also help business owners assess costs and make informed decisions about growth.
optional anymore
on running the business